

Logistic Regression


What is Logistic Regression
Logistic regression estimates the probability of an event occurring,Such as if a person would buy or not,like True or False
In logistic regression, the logistic function is used to map the odds to probabilities. The logistic function has a characteristic S-shaped curve and is a common method to model a binary outcome (success or failure, yes or no, etc.) based on one or more predictors.
Formulas in Logistic Regression
Odds: This is the ratio of the probability of success to the probability of failure. It is calculated as: Odds=𝑝1−𝑝Odds=1−pp where 𝑝p is the probability of success.
Log Odds (Logit Transformation): This transformation takes the natural logarithm of the odds: logit(𝑝)=ln(𝑝1−𝑝)logit(p)=ln(1−pp) This transformation makes it easier to work with odds, especially when calculating the linear combination of predictors.
Logistic Function: This function maps log odds back to probabilities. It is given by: 𝜎(𝑥)=11+exp(−𝑥)σ(x)=1+exp(−x)1 where exp(−𝑥)exp(−x) is the exponential function.
Logistic Regression
In logistic regression, you use a linear combination of predictor variables and apply the logistic function to get the predicted probability. Mathematically, this can be represented as:
𝑝=11+exp(−(𝑏0+𝑏1𝑥1+…+𝑏𝑛𝑥𝑛))p\=1+exp(−(b0+b1x1+…+bnxn))1
where:
b0 is the intercept (constant term),
b1,…,bn are the coefficients for each predictor variable x1,…,xn,
p is the probability of the event occurring (success).
The goal of logistic regression is to estimate the coefficients b0,b1,…,bn such that the model can predict the probability of an outcome based on the input features.
Overall, logistic regression is a useful model for classification problems where the outcome variable is binary (like success/failure or yes/no), and it is commonly used in a variety of fields, including finance, healthcare, marketing, and social sciences.
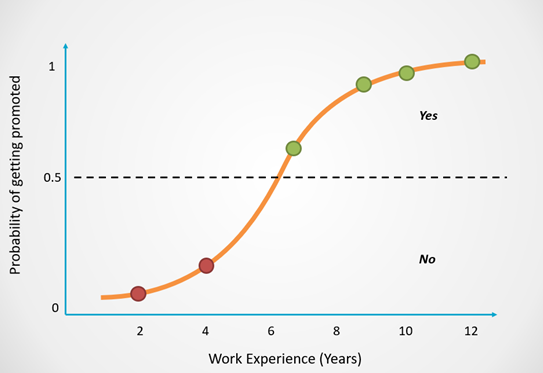
y-axis is the probability of occurrence and x-axis is the continuous variable
DIFFERENCE BETWEEN LINEAR REGRESSION AND LOGISTIC REGRESSION
Linear Regression
Purpose: Linear regression is used to model relationships between a continuous dependent variable and one or more independent variables. Its goal is to identify a linear relationship or trend.
Application: It works well when the outcome is a continuous numerical value. For instance, it can be used to predict house prices based on factors like size and location.
Output: The result is a linear equation, usually in the form 𝑦=𝑏0+𝑏1𝑥1+…+𝑏𝑛𝑥𝑛_y_=_b_0+_b_1_x_1+…+_b_n_x_n, where 𝑦_y represents the predicted value, 𝑏0_b_0 is the intercept, and 𝑏1,…,𝑏𝑛_b_1,…,𝑏_n are coefficients for the independent variables.
Assumptions: It relies on assumptions of linearity, independence, constant variance (homoscedasticity), and normally distributed residuals.
Visualization: Linear regression can be depicted as a straight line that best fits the data points.
Logistic Regression
Purpose: Logistic regression models the relationship between a categorical dependent variable (usually binary) and one or more independent variables. It's commonly used for classification tasks.
Application: Great for predicting binary outcomes, like whether a customer will purchase a product or not, or if an email is spam or not.
Output: The result is a probability, showing the chance of an event happening. It uses the logistic function to convert linear combinations of predictors into probabilities. The formula is: 𝑝=11+exp(−(𝑏0+𝑏1𝑥1+…+𝑏𝑛𝑥𝑛))p\=1+exp(−(_b_0+_b_1_x_1+…+bn__xn_))1 where 𝑝_p is the success probability, and 𝑏0,𝑏1,…,𝑏𝑛_b_0,_b_1,…,_bn_ are coefficients for the independent variables.
Assumptions: It assumes the outcome variable is binary and that the log odds of the dependent variable can be represented as a linear combination of the independent variables.
Visualization: Visualizing logistic regression shows an S-curve, illustrating the connection between the log odds and the linear combination of predictors.